Misconduct by Type
these statistics show the percentile of the different types of arrests police have made and the different types of scenarios that go along.
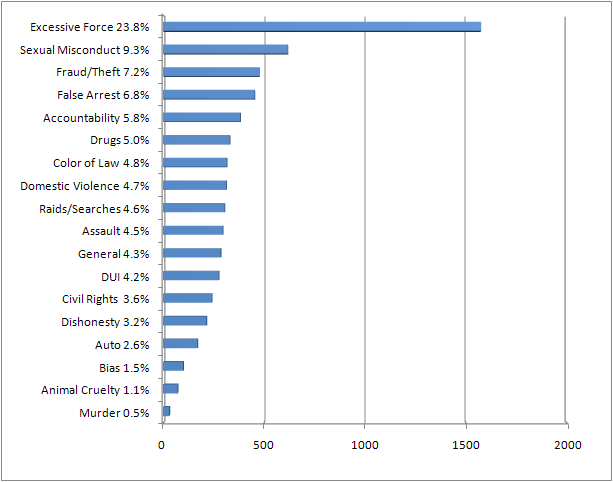
"Of the 6,613 law enforcement officers involved in reported allegations of misconduct that met NPMSRP criteria for tracking purposes, 1,575 were involved in excessive force reports, which were the most prominent type of report at 23.8% of all reports. This was followed by sexual misconduct complaints at 9.3% of officers reported then theft/fraud/robbery allegations involving 7.2% of all officers reported. The following chart displays the breakdown of misconduct types by percentage of reports and the number of reports each by type."
these statistics show the percentile of the different types of arrests police have made and the different types of scenarios that go along.
"Of the 6,613 law enforcement officers involved in reported allegations of misconduct that met NPMSRP criteria for tracking purposes, 1,575 were involved in excessive force reports, which were the most prominent type of report at 23.8% of all reports. This was followed by sexual misconduct complaints at 9.3% of officers reported then theft/fraud/robbery allegations involving 7.2% of all officers reported. The following chart displays the breakdown of misconduct types by percentage of reports and the number of reports each by type."
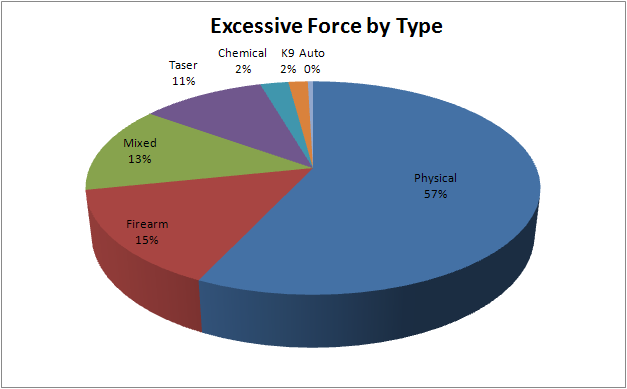
"Of all 1,575 officers involved in reported excessive force complaints, 897 (56.9%) were involved in cases of physical use of force complaints which include fist strikes, throws, choke holds, baton strikes, and other physical attacks. 232 officers (14.7%) were involved in firearm-related excessive force complaints, 166 (10.6%) were involved in taser-related cases, and the remaining officers were involved in other cases involving a combination of force types (13.21%), use of police dogs (1.7%), police vehicles (0.4%), and chemical weapons (2.4%)."
These are the different types of ways police have used physical abuse towards people in an excessive manner who were being arrested.
These are the different types of ways police have used physical abuse towards people in an excessive manner who were being arrested.
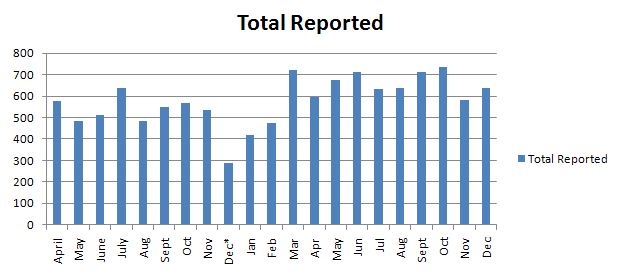
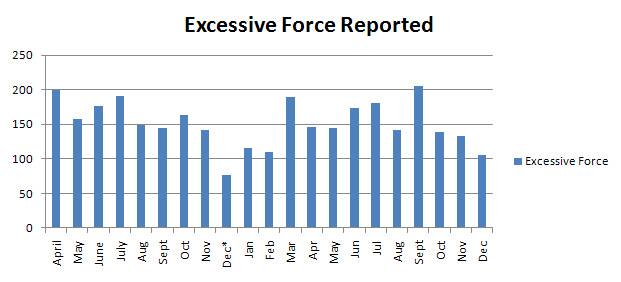
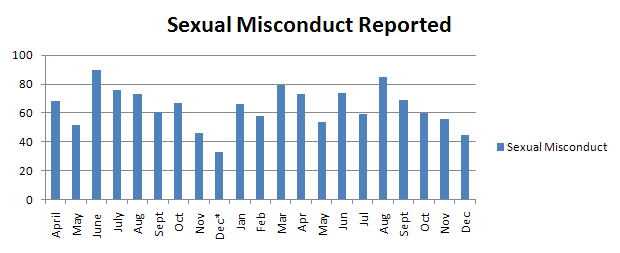
Misconduct reports through the year of 2010
These three graphs will show the levels as a whole, and other misconduct reported incidents that had occurred, and to also give a visual of the percentages of monthly reporting. "While the overall US average police misconduct rate appears to be climbing in comparison to both last year’s rate and the previously reported rate 3 months ago it is difficult to see a clear causative factor for the increase and it isn’t clear what type of misconduct is increasing to cause this trend though the number of officers involved in excessive force reports appear to be demonstrating an overall trend increase since the beginning of 2010."
These three graphs will show the levels as a whole, and other misconduct reported incidents that had occurred, and to also give a visual of the percentages of monthly reporting. "While the overall US average police misconduct rate appears to be climbing in comparison to both last year’s rate and the previously reported rate 3 months ago it is difficult to see a clear causative factor for the increase and it isn’t clear what type of misconduct is increasing to cause this trend though the number of officers involved in excessive force reports appear to be demonstrating an overall trend increase since the beginning of 2010."